The cost of product analytics data in your data warehouse
Syncing product analytics data into your warehouse is more expensive than you might think. This explains why, and what to do about it.


Warehouses are both the present and future of data analytics. They provide an easy way for companies to write SQL across all their different data sources. Today, data warehouses have gotten so powerful and fast that you can build full products on top of them.
As the trend to do more inside your data warehouse continues, we see that product analytics companies / CDPs are all supporting this movement. In this post, I want to illustrate the hidden expense of using product analytics data in your data warehouse.
Product analytics tools enabling data syncing to your warehouse
To be clear, these types of companies have always had an SDK/js snippet to let you track data into the tool, and a UI that allows you to analyze that tracked data. But they now have a third piece to the offering: Data sync capability to move that data into your data warehouse
- Amplitude: New Snowflake Integration Delivers the Modern Data Stack (amplitude.com)
- HEAP: Heap Connect: Overview & Setup - Heap Help Center
- Segment: Warehouse Syncs | Segment Documentation
- Snowplow: Integrate your data stack with Snowplow | Snowplow (snowplowanalytics.com)
- Rudderstack: Warehouse Destinations | RudderStack Docs
- Mixpanel: Save engineering time on your data warehouse pipeline - Mixpanel
- Google Analytics: [GA4] Set up BigQuery Export - Analytics Help (google.com)
- If your warehouse is BiqQuery → Google Analytics 4 (GA4) will track and send the data into your BigQuery cluster for free
- If you are using Fivetran → They have open source Segment and Snowplow connectors so you get the benefits of the JS snippet while getting data directly into your warehouse
The challenges with using product analytics data in your data warehouse
Leveraging the product analytics data becomes prohibitively expensive because it needs to be transformed/prepared into a different format to extract any insights from it.
This cost comes from 2 main categories:
- The resource cost to transform the data into usable tables (Data Engineering Time)
- The compute cost of the data warehouse to materialize this data
Why do I need to transform it?
The data is time-series - Time-series data is extremely difficult to query with SQL. This is because events in the time-series data don’t relate to each other via any identifier we can use to join. The questions that you want to answer–what was the last paywall before a purchase, which campaign led to an order, etc...–become very complex queries. No BI tool (i.e. Looker, Tableau, etc...) has been able to solve this problem.
Identity needs to be resolved across multiple systems - A user in your product analytics table is difficult to match to the user in your internal systems. This is such a complex problem that there are many companies (intricity for example) that exist solely to stitch the anonymous user cookie to your internal identifier.
Some data is missing (gaps in tracking) - These front-end trackers are always missing lots of data. Ad blockers, refusal to accept cookies, browser cookie resets, mistakes in engineering implementation, and many more lead to a lot of gaps that data engineering needs to handle.
A quick test to evaluate your front-end data: count how many orders/sessions/conversions came from your front-end tracker last month vs how many are in your actual system.
Data needs to fit your existing data infrastructure to be useful - Your existing data is already transformed into a format that works with your BI and dashboarding tools. For your product analytics data to be useful you'll need to join it with the other data in your warehouse.
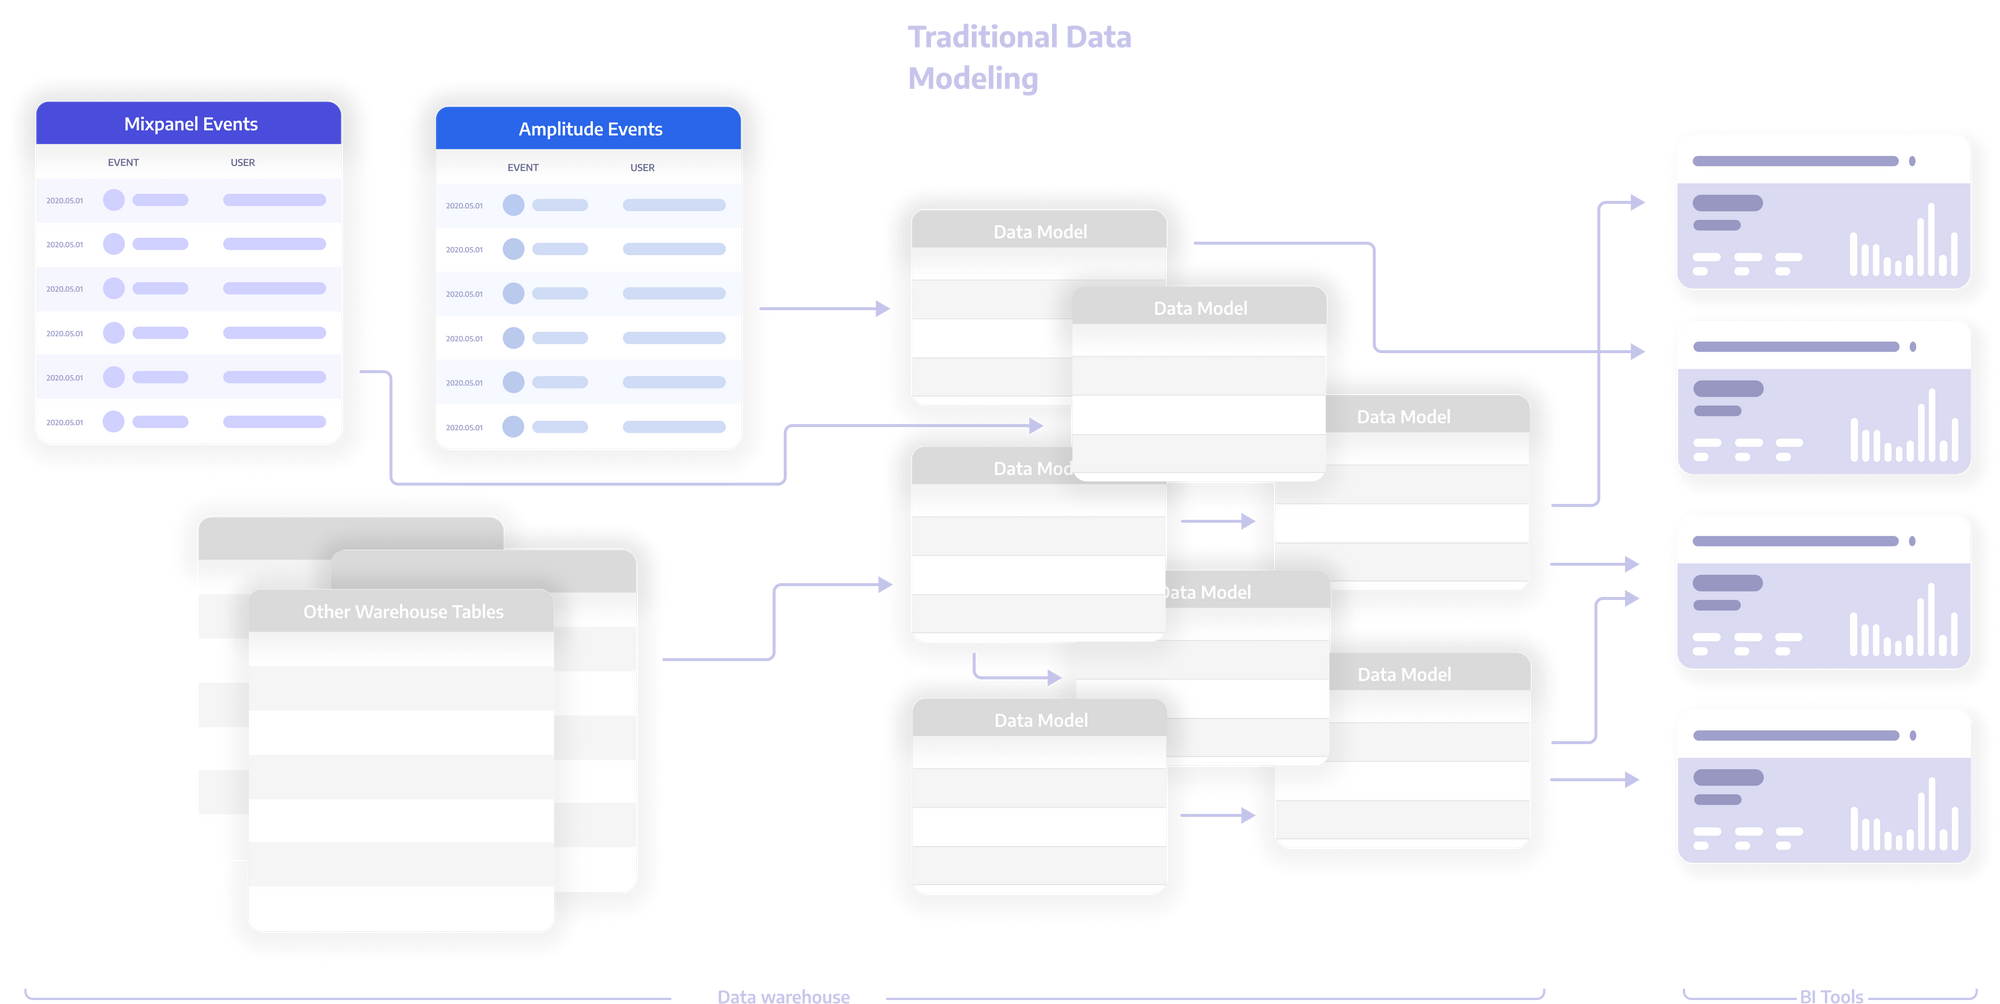
How hard is it to transform this data?
REALLY REALLY HARD!
There are 2 main factors when dealing with transforming the data:
- Every new question needs its own transformation
- Every transformation can only be written by an expert
When we ask questions using product data, we are often relating two new elements together. These relationships are not reusable when you need to relate two completely different elements. For example, tying a paywall to a purchase is a very different query than tying an email to an order. For this reason, a data engineer needs to actively write SQL to make this work for each new question.
Because these queries are extremely complicated, you need to invest senior data engineering resources–especially given the risk of duplicating rows, dropping rows, connecting the wrong data inadvertently, etc...
Estimating the cost of transforming the data
Hopefully, by now you understand that you need to transform the data to extract any insight. Now, let's dive into the costs: Senior data engineering time to transform the data and warehouse compute cost.
Data Engineering Cost
Assumptions:
- 20 new questions per month
- Each question takes a senior engineer 2 days to write the SQL
- An average senior engineer makes $160k/yr
COST CALCULATION: 20 Questions * 2 days / 260 workdays/ year * $160k salary per year =
Materialization Cost on the warehouse
Assumptions:
- 20 new questions per month
- Each question bridges 3 different events from your product analytics tool
- $5 per TB compute cost (BigQuery docs)
- 1B row event stream table coming from your product analytics tool (average size for mid-staged companies)
- Using Segment to capture data and send it into your warehouse (the most common JS tracker)
- 1 materialized table per question since the answer will be provided in a dashboard
- Materializing each table every hour, so dashboards are near real-time
COST CALCULATION: 20 Questions * 1 Table/question * 1B rows * 3 joins * 200 GB/B rows * $0.005 Cost/GB * 24 hrs/day * 30 days/month =
FAQ:
Before going into the total cost I wanted to share some concerns that I know people will have and answer them.
Why don’t you incrementally materialize the data?
When you are dealing with incremental materialization on tables with any joins, the moment the data is incrementally materialized, you're making the assumption that every table you're using is up to date. This issue is caused by ETL jobs completing at different times. If you have 2 tables, and one table is up-to-date and another is not, and in your SQL snippet you’re joining those two tables together, when the materialization runs, rows will be dropped. When the second table is up to date, it’s now too late.
Why can't I create a query to answer a couple of questions?
I am assuming you will, but you will probably still have at least 20 new questions that will need a new model.
Why are you multiplying the rows by the joins?
Like most product analytics tools, Segment has a tracks table for all events but then an individual property table for each event's properties. In order to answer each question you can't just rely on the tracks table, you'd need to scan the property tables as well, so I am expecting multiple tables to be joined. This complexity will grow so I am using this multiplication as a proxy.
What can I do about this?
Given the difficulty and expense to take advantage of product analytics data in your warehouse, where does that leave us? With the existing modern data stack, we have the following options:
- Use the native analytics UI inside the respective product analytics tools to answer only product questions
- Take the time and energy to do the transformations anyway
- Attempt to sync your warehouse data into these product analytics tools (though we recommend reading this first: What's missing from the Amplitude and Snowflake partnership)
There’s also a much better fourth option
Some data tools like Amplitude are heading in this direction with the ability to sync data back to Snowflake. Unfortunately that doesn't quite get us there. For real data analysis you need something that works natively on your warehouse.
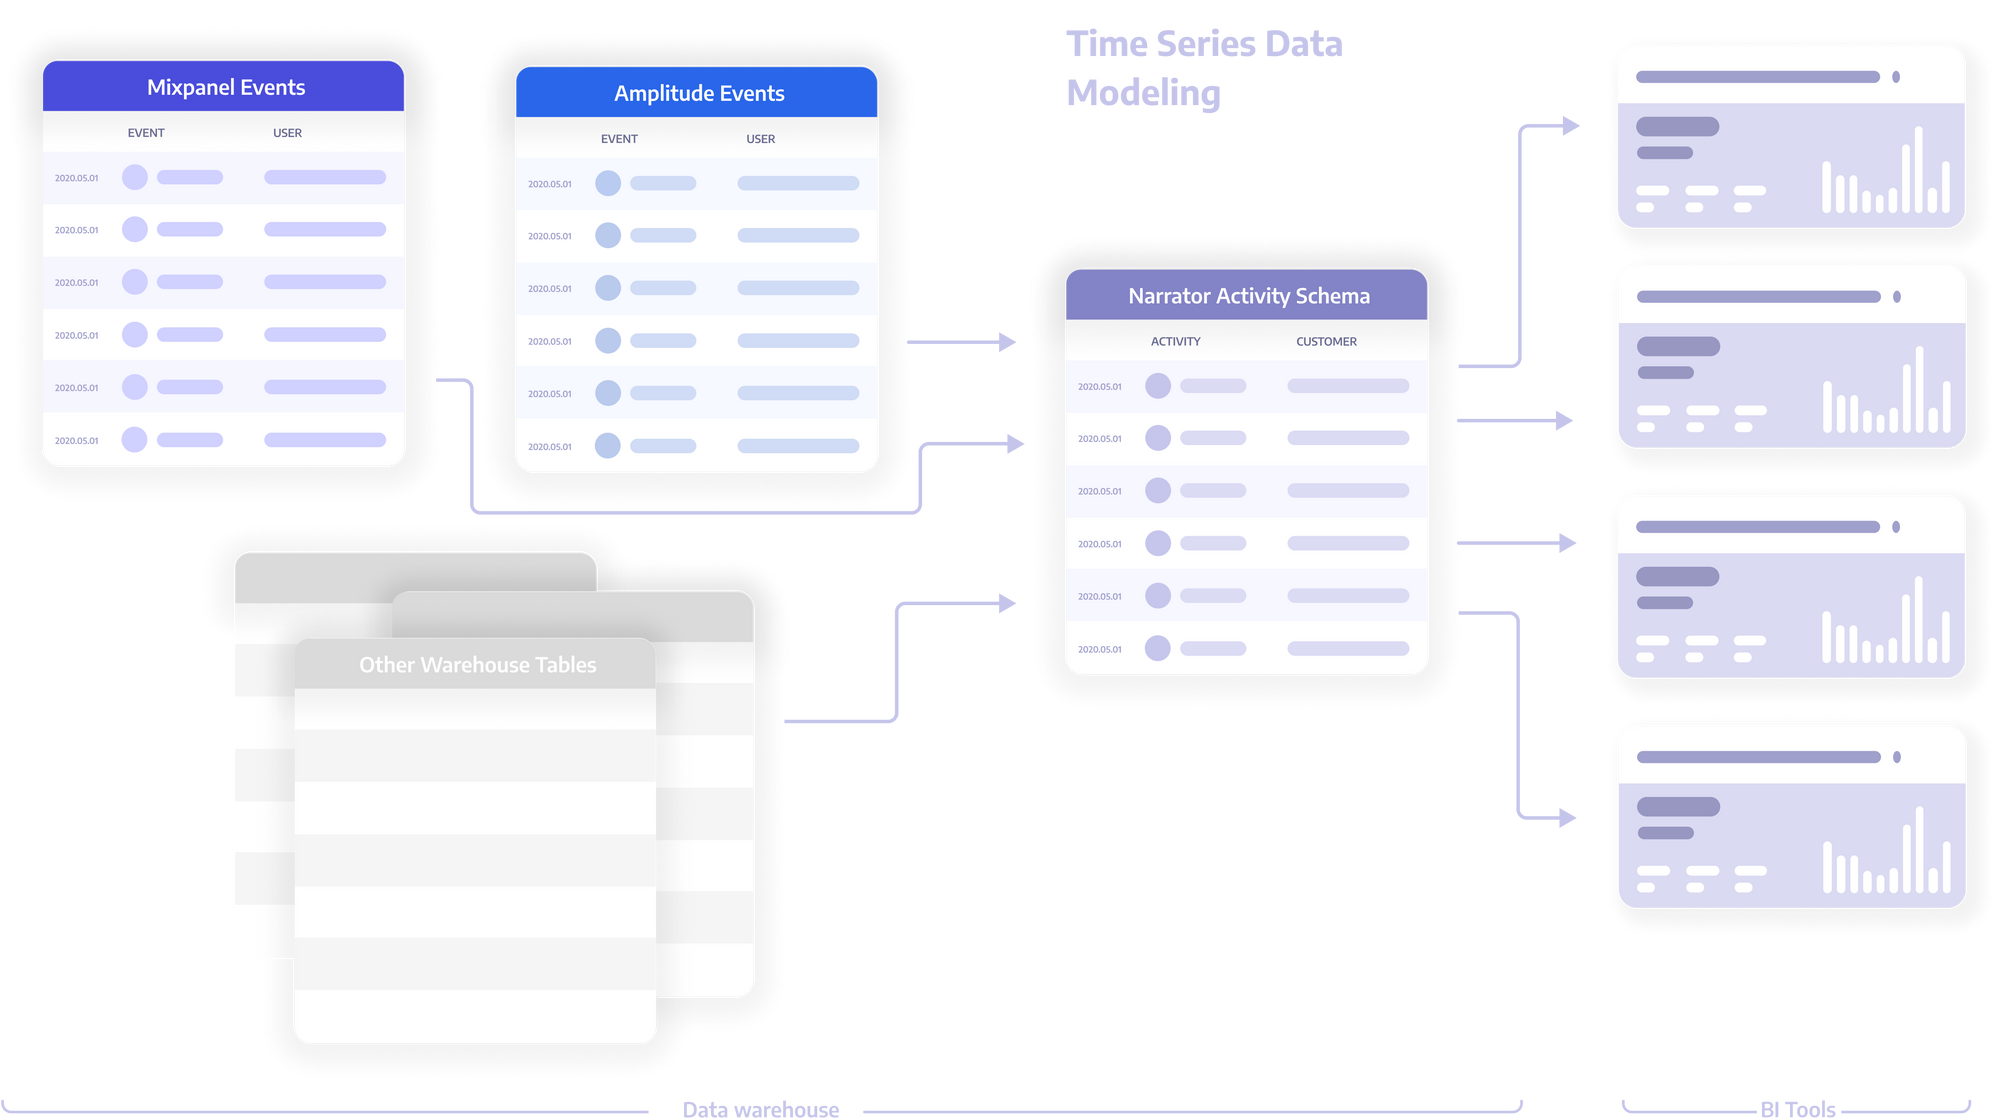
Narrator is among a new class of data tools that works with time-series data natively on top of data warehouses. The idea is to treat time-series data as the basis for all analysis. This means that it can relate any time-series data together with simple queries and build materialized views to integrate with BI tools and the rest of your data stack. In other words, time-series data is no longer hard to query or use for analysis.
It can also go one step further. It’s actually far simpler to transform existing non time-series data into a time-series format than the other way around. Narrator can very quickly (and cheaply) transform any warehouse data into a time-series format, and from there allow you to answer questions across the entire customer journey easily.
Narrator also handles all the issues discussed earlier:
- Incrementally updates the data so the load on your warehouse is tiny
- Allows you to combine events seamlessly to build tables for BI
- Compiles efficient SQL queries on your warehouse under the hood
- Built-in identity resolution
If you think you might be running into this issue, I would love to go over it with you and help you optimize your warehouse cost. Feel free to message me on LinkedIn: Ahmed Elsamadisi | LinkedIn