Identifying bot traffic with SQL
Systematically identify bot users in your web traffic with a simple SQL query.


Web data usually includes bot traffic of some kind. Whether it’s an automated test user or an unwanted web scraper, you’ll want to remove them from your data before using it for reporting or analysis.
This SQL query is a quick and easy way to systematically identify non-human browsing behavior so you can spend less time cleaning data and more time doing the fun stuff.
What data do you need
You'll need a dataset that represents each page view of the user over time (or a similar browsing behavior, like clicks). This query was written using syntax for Amazon Redshift warehouses and basic page view data from Segment, but you can easily adapt it for any page view data source and warehouse combo.
SQL Query
SELECT
	v.anonymous_id
FROM (
	SELECT
        p.message_id
        , p.anonymous_id
		, p.timestamp
		, LAG(p.timestamp) over
		 (PARTITION BY p.anonymous_id ORDER BY p.timestamp ASC)
			as last_pageview_ts
	FROM website.pages p
	) v


WHERE date_diff('minute', v.last_pageview_ts, v.timestamp) < 30
    and v.last_pageview_ts is not null

GROUP BY 1

HAVING
	avg(date_diff('ms', v.last_pageview_ts, v.timestamp)) <= 1000
	and COUNT(1) > 10
How it works
At a high level this query uses page view data to find the visitors who viewed many pages (> 10) at a very fast speed (< 1 second between views on average). Viewing that many pages so quickly is a strong indication that the viewer is not human and should be removed from the data before analysis.
We defined these thresholds using our common sense about what was and wasn't normal user behavior. If you want to be objective about it, I include some tips at the end to show how you can use your data to inform the thresholds.
Let’s break it down
Step 1 - Calculate the time between each page view
LAG(p.timestamp)
	over (PARTITION BY p.anonymous_id
    	ORDER BY p.timestamp ASC)       as last_pageview_ts
Step 2 - Exclude any sequential page views that came from different sessions
WHERE date_diff('minute', v.last_pageview_ts, v.timestamp) < 30 Eventually we will want to calculate the average time between each page view, and if we include the time between sessions we’d severely skew our average. By removing these records we can ensure we’re only calculating the time between page views that are within a the same session.
Step 3 - Compute the average time between each page view for each user and filter for only users with average time between views < 1 second (1000 milliseconds)
avg(date_diff('ms', v.last_pageview_ts, v.timestamp)) <1000 Step 4 - Exclude anyone with less than 10 page views
COUNT(1) > 10The query will return a list of users who have viewed over 10 pages, at an average rate of less than 1 second per page view. It's a good idea to spot check these users and their page view behavior to make sure the selected anonymous_id look bot-like.
Tip: Adjust the filters for average time between views and total page views to make the algorithm more or less restrictive.
Once you adjust those parameters, you'll have your list of bot-users ready to go!
And that's it!
The last step is to remove them from all of your modeled tables. Narrator makes it easy to exclude a dynamic list of users, so you don't have to worry about them sneaking into your datasets. Learn more
BONUS: Selecting good thresholds using data
In this section, I'll share some tips for choosing a good threshold using existing behavioral data. These methods are unsupervised, meaning we don't have a labeled dataset that tells us which user is actually a bot and which is not, so we won't be building some fraud detection model. These are just simple heuristics you can use to choose a more informed threshold.
The goal is to determine what should be considered abnormal behavior compared to the rest of the users on your website. Behavior will vary depending on your site, so we'll take a look at the distribution of each of these metrics to determine what is normal and what is not, before choosing the thresholds.
Threshold for Time Between Page Views
The SQL below uses the PERCENTILE_CONT() function from Redshift to calculate various percentiles for the time between each page view. This will give us a sense of the distribution without having to do a deeper analysis.
with pvs as (
    SELECT
        p.message_id
        , p.anonymous_id
		, p.timestamp
		, LAG(p.timestamp) over
		 (PARTITION BY p.anonymous_id ORDER BY p.timestamp ASC)
			as last_pageview_ts
	FROM website.pages p
),

time_between as (

    SELECT
        v.anonymous_id
        , date_diff('ms', v.last_pageview_ts, v.timestamp) ms_btwn_pvs

    FROM pvs v
    WHERE date_diff('minute', v.last_pageview_ts, v.timestamp) < 30
        and v.last_pageview_ts is not null

)

SELECT
    PERCENTILE_CONT(0.990) within group (ORDER BY ms_btwn_pvs desc) over () as ptile_99
    , PERCENTILE_CONT(0.950) within group (ORDER BY ms_btwn_pvs desc) over () as ptile_95
    , PERCENTILE_CONT(0.90) within group (ORDER BY ms_btwn_pvs desc) over () as ptile_90
    , PERCENTILE_CONT(0.750) within group (ORDER BY ms_btwn_pvs desc) over () as ptile_75
    , PERCENTILE_CONT(0.500) within group (ORDER BY ms_btwn_pvs desc) over () as ptile_50
    , PERCENTILE_CONT(0.250) within group (ORDER BY ms_btwn_pvs desc) over () as ptile_25
FROM time_between
LIMIT 1
Query Output (in milliseconds)
| PTILE_99 | PTILE_95 | PTILE_90 | PTILE_75 | PTILE_50 | PTILE_25 |
|---|---|---|---|---|---|
| 836.0 | 2946.0 | 3646.0 | 4618.0 | 6258.0 | 20654.0 |
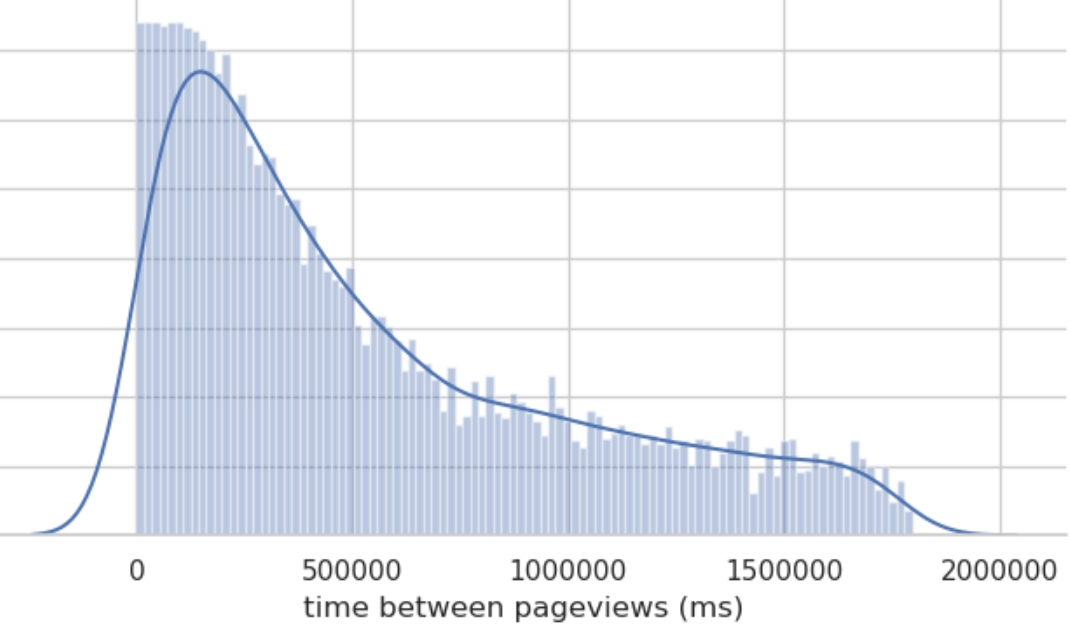
The query will output the various percentiles for time between page views. For example, PTILE_75 is the 75th percentile for time between page views, meaning that 25% (100% - 75%) of page views happen within 4,618 milliseconds or less of the page view before it. For reference, 4,618 ms is equivalent to 4.618 seconds. That aligns with what we'd expect from typical page view behavior on a website.
You can also visualize the distribution (like the plot) to get a better sense, but the SQL output should be sufficient for determining a good threshold.
Selecting the Threshold
Once you have a better understanding of the distribution, you can choose an informed threshold for the time between page views. For a very conservative threshold, choose PTILE_99 (99th percentile for shortest time between page views) or the 95th or 90th percentile for something more lenient. To make things simple, I chose 1,000 ms for my threshold, because it was a nice number between the 99th percentile and the 95th percentile based on my data.
To update the query, just change the line with 1,000 in the bot query to your new threshold:
avg(date_diff('ms', v.last_pageview_ts, v.timestamp)) < 1000Threshold for Total Page Views
We'll use the same methodology to select a threshold for total page views. First, using the SQL below, we'll compute the total of page views for each user and calculate the percentiles to get a better idea of the distribution.
with pvs as (
    SELECT
        p.message_id
        , p.anonymous_id
		, p.timestamp
		, LAG(p.timestamp) over
		 (PARTITION BY p.anonymous_id ORDER BY p.timestamp ASC)
			as last_pageview_ts
	FROM website.pages p
),

total_views as (

    SELECT
        v.anonymous_id
        , count(1) total_pvs

    FROM pvs v
    WHERE date_diff('minute', v.last_pageview_ts, v.timestamp) < 30
        and v.last_pageview_ts is not null
    GROUP BY 1

)

select
    PERCENTILE_CONT(0.990) within group (ORDER BY total_pvs ASC) over () as ptile_99
    , PERCENTILE_CONT(0.950) within group (ORDER BY total_pvs ASC) over () as ptile_95
    , PERCENTILE_CONT(0.90) within group (ORDER BY total_pvs ASC) over () as ptile_90
    , PERCENTILE_CONT(0.750) within group (ORDER BY total_pvs ASC) over () as ptile_75
    , PERCENTILE_CONT(0.500) within group (ORDER BY total_pvs ASC) over () as ptile_50
    , PERCENTILE_CONT(0.250) within group (ORDER BY total_pvs ASC) over () as ptile_25
from total_views
limit 1
Query Output
| PTILE_99 | PTILE_95 | PTILE_90 | PTILE_75 | PTILE_50 | PTILE_25 |
|---|---|---|---|---|---|
| 13 | 13 | 13 | 12 | 4 | 2 |
Selecting the Threshold
And just like before, we have the percentiles to get a better idea of the distribution of total page views. And we'll choose an appropriate threshold for our bot query. I choose this threshold to be a bit more lenient (10) because I expect most bots to be detected by their time between page views and not the total pages they've viewed on the site.
Once you've determined the threshold you want to use, just change this line from the bot query by replacing 10 with your threshold.
and COUNT(1) > 10
And that's it. You've analyzed the typical behavior of users on your site and can adjust the thresholds accordingly.
Let’s find those robots!!

