Announcing the Analyze Button
Overview of the Analyze Button, the first self service data analysis tool. It creates a full analysis, with recommendations, in one click.


Narrator's vision is to help everyone make better decisions with data. Data teams don't have the bandwidth to help with most decisions, so every company needs some sort of self service.
Today we're announcing the first self serve analytics tool that tells you "why?". It's a simple, instant, and automatic data analysis tool that we call the analyze button.
It's the world's first truly self service data analysis tool. It's designed to both present a full analysis with recommendation for business stakeholders, and to accelerate the work of data analysts by automating manual steps.
How does it work?
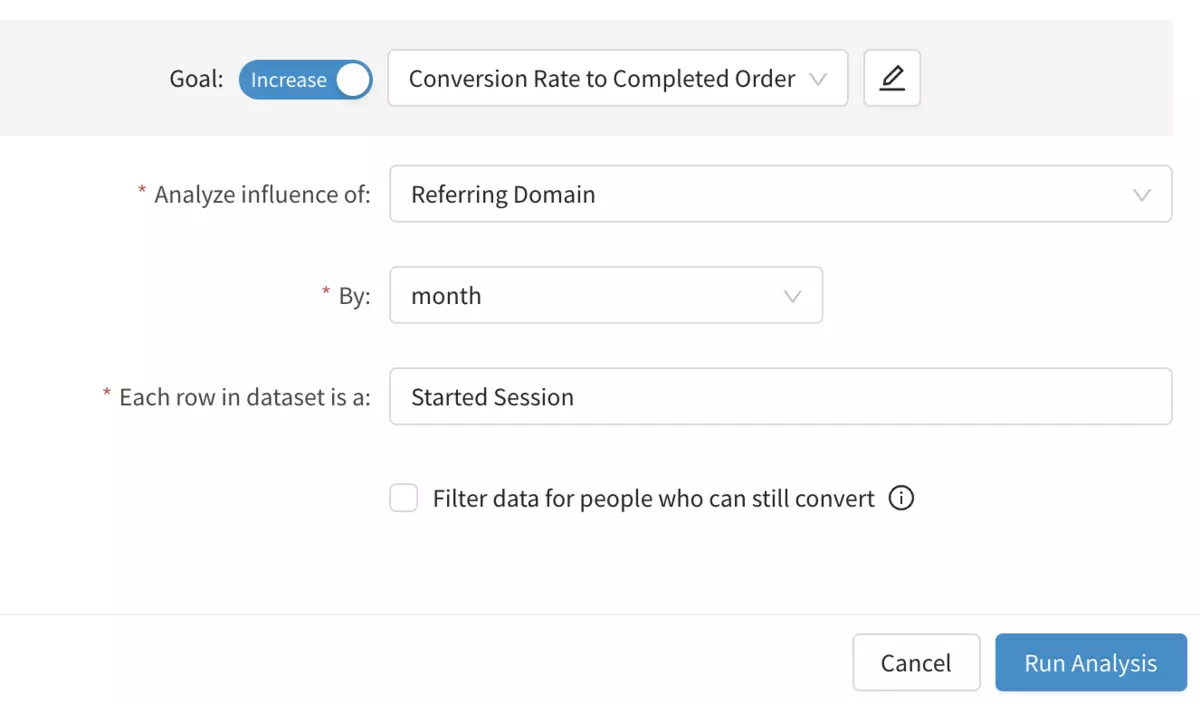
Pick a metric you're trying to improve and something that you think might affect it. Narrator will generate an in-depth analysis with a recommendation.
For example
I think the referring domain for website visits affects conversion to a lead. Would it help to focus our content efforts more on certain sites?
Narrator will see how referring domain impacts conversion, check whether changing the referring domain would have an impact, and present the results in a story-like format.
Here's the first part of the example analysis
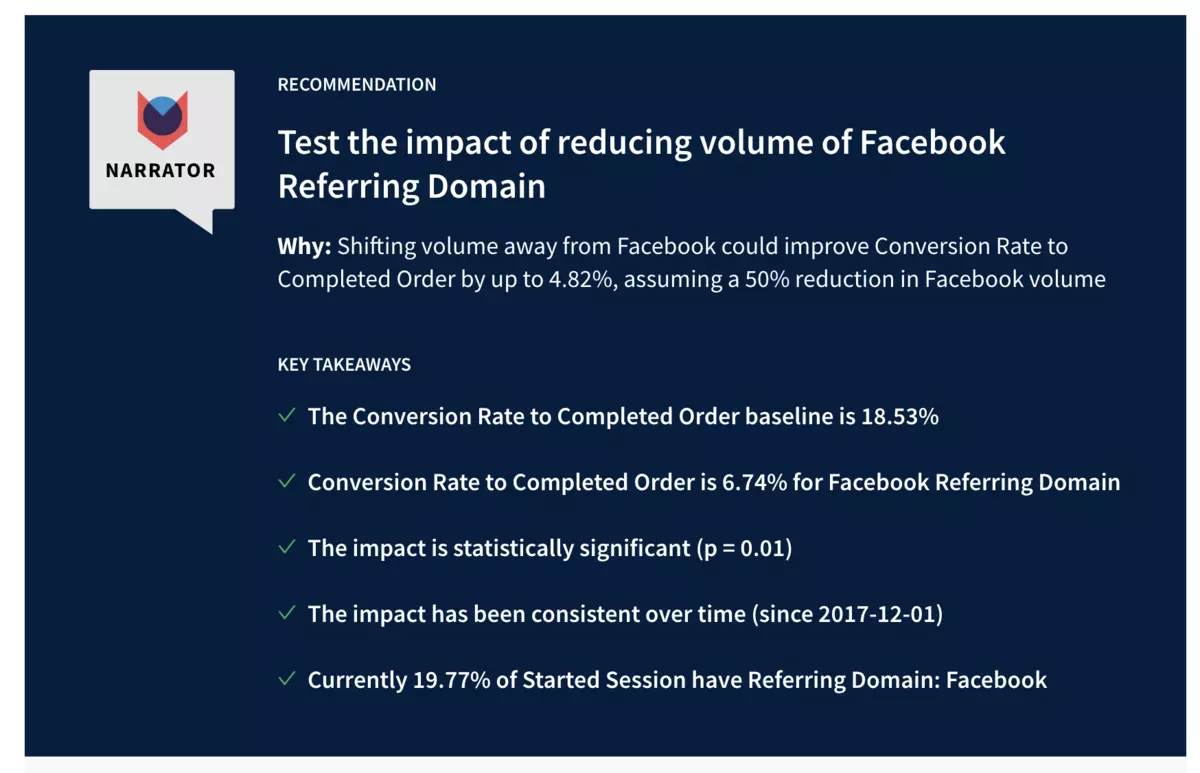
It starts with a specific recommendation — increasing visits from sites other than Facebook will likely improve conversion.
The rest of the analysis shows how we arrived at these key takeaways — it presents the data as a story and builds to the conclusion step by step.
If you're curious you can download a pdf to see the full example.
First true automated analytics
The idea of automated analysis isn't new. So why are we so excited about the analyze button? To our knowledge it's the first product that truly succeeds at automating in-depth analysis.
An automated analysis should follow the same approach as a human analyst. It should have a specific recommendation, be easy to understand, and start from a real question. It should work across any data and should be quick to configure and use.
All previous automated approaches have either fished for insights among thousands of metrics — with no clear explanation for 'why' something is an insight — or focused on a very narrow domain.
Narrator's analyze button is unique in several key ways
- actionable — provides a specific, relevant recommendation
- human-driven - accelerates analysis by automating the manual steps an analyst would do
- simple - anyone, technical or not, can understand the analysis and follow its steps
- comprehensive - works on any data in the warehouse across any business domain
- fast - less than 10 min to set up, run, and get results
- focused - it always starts from a specific hunch or question rather than casting a broad net
- continuous - all analyses run weekly and notify if a recommendation changes
- transparent - all data, logic, decisions, etc in an analysis can be viewed, explored, and adjusted using the standard dataset tool
Self service analytics
The analyze button is an effective way to lessen the pressure on the data team. For stakeholders it's the first tool that can answer 'why' something happened, using any data available in the warehouse.
For example, say a customer support manager wants to know if a good customer support experience relates to customers upgrading to a higher tier. The first question they might ask with the analyze button is
- how does number of support tickets submitted influence upgrading a subscription?
The analysis shows that, interestingly, there isn't too much of an effect. So the manager asks a different question
- how does rating a support ticket highly influence upgrading a subscription?
The result is that high-rated tickets do improve subscription upgrade rates. So now the manager wants to understand what makes tickets get rated highly. Their next hunch is that the time to respond to a support ticket might relate. So they ask
- how does time waiting for a response influence support ticket rating?
And they see that response times have an effect also. The analysis recommends that reducing response times from 30 hours to below 20 will improve support ticket ratings by 10%.
This is definitely actionable. The marketing manager can work on improving the response times over the next few weeks and periodically check back with the analyses to see if the numbers have indeed improved.
While the analyze button is approachable enough for stakeholders making a decision, it's also powerful enough for analysts. It builds its analysis the same way a senior analyst does — by starting with a metric to improve, a hunch for what might affect it, and a little bit of data work to check how they relate.
Why human-guided analysis is critical
The way the analyze button works is pretty straightforward. There's no AI or machine learning making opaque decisions. Everything is guided by the person requesting the analysis.
We've automated the mechanics of building an analysis, but not the intent. In other words, this requires a human with a specific goal and ideas. We'll follow a set process to explore how two things relate, but we have to be told what to look at. Everything is guided by the person pressing the button.
Why is this so important? We could, for example, test every possible customer behavior to check if it affects conversion rate to completed order. But that's not helpful for two reasons.
First, it'll generate a lot of noise: "visiting the checkout page affects conversion to completed order: we recommend you increase visitors to that page". Not terribly helpful.
Second, and more importantly, it's not answering a question you're wondering about right now. You're not going to act on a random set of recommendations. Even if they're decent, they're still effectively useless.
Our approach is to let people's hunches drive the analysis. If you're curious about something, and it takes only a few minutes to figure it out, then you'll probably look into it. We've found that early users of the analyze button have actually started asking more questions.
Use Cases
The analyze button can be used for any question of the form "How does a feature influence my KPI?" Most business questions fit into this format naturally. Here are some real examples
E-commerce
- How does using a discount code influence average order value?
- How does rating a product influence repurchase rate?
- How do shipment times influence repurchase rate?
SaaS
- How does viewing the promo banner influence site conversion?
- How does the first product you purchase influence retention rate?
- How does the number of support tickets submitted influence churn rate?
Product Analytics
- How does number of videos played influence number of app opens per week?
- How does adding 3+ friends influence number of app opens per week?
- How does distance from a bike kiosk influence number of rides taken per week?
Customer Success
- How does time spent waiting for a response influence support ticket rating?
- How does rating a support ticket high influence upgrading a subscription?
Getting started
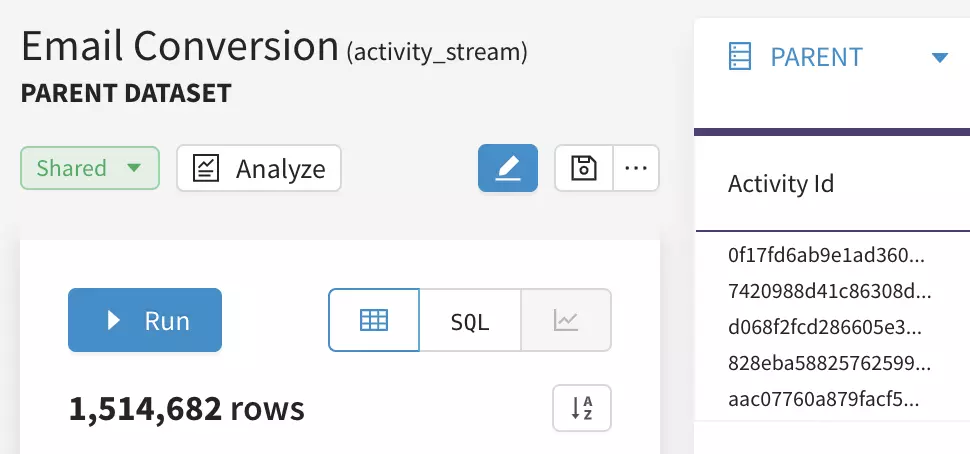
The analyze button lives on our dataset tool.
It requires two key pieces of information
- What you are trying to improve (conversion to a sale, retention rate, average order value) — what we call the KPI
- What you think might affect it (promo code, number of support tickets, use of discounts) — this is a feature in the dataset
From there build a dataset with both the initial activity and the activity to convert to. Ensure the feature is brought in as one of the columns.
Press the button and choose the relevant options.
That's it! For more in-depth guidance on how to do this refer to our docs